在需求开发的过程中, 有次启动项目, 发现启动太慢.下面通过简化, 创建一个简单的 demo 程序来观察此现象.
主程序很简单:
1
2
3
4
5
6
7
8
9
10
@SpringBootApplication public class Application { private static final Logger LOG = LoggerFactory.getLogger(Application.class); public static void main(String[] args) { SpringApplication.run(Application.class, args); LOG.info("App start"); } }
两个配置文件, 一个配置了列表, 一个配置了 map.
列表文件如下所示:
1
2
3
4
5
6
# 配置列表, 大概有 1万 1 千多个元素. zip: - 641004 - 641006 - 400601 ...
map 配置如下所示:
1
2
3
4
5
6
7
# 配置 map, 大概有 4万 2 千多个元素 codeMap: 00501: 1 00544: 1 00601: 7 00602: 7 ...
两个对应的配置类如下.
列表配置:
1
2
3
4
5
6
7
8
9
10
11
12
13
@ConfigurationProperties(locations = "classpath:zip.yaml") @Component public class Zip { private List<String> zip = new ArrayList<>(11790); public List<String> getZip() { return zip; } public void setZip(List<String> zip) { this.zip = zip; } }
map 类配置:
1
2
3
4
5
6
7
8
9
10
11
12
13
@ConfigurationProperties(locations = "classpath:codemap.yml") @Component public class CodeMap { private Map<String, Integer> codemap = Maps.newHashMapWithExpectedSize(42358); public Map<String, Integer> getCodemap() { return codemap; } public void setCodemap(Map<String, Integer> codemap) { this.codemap = codemap; } }
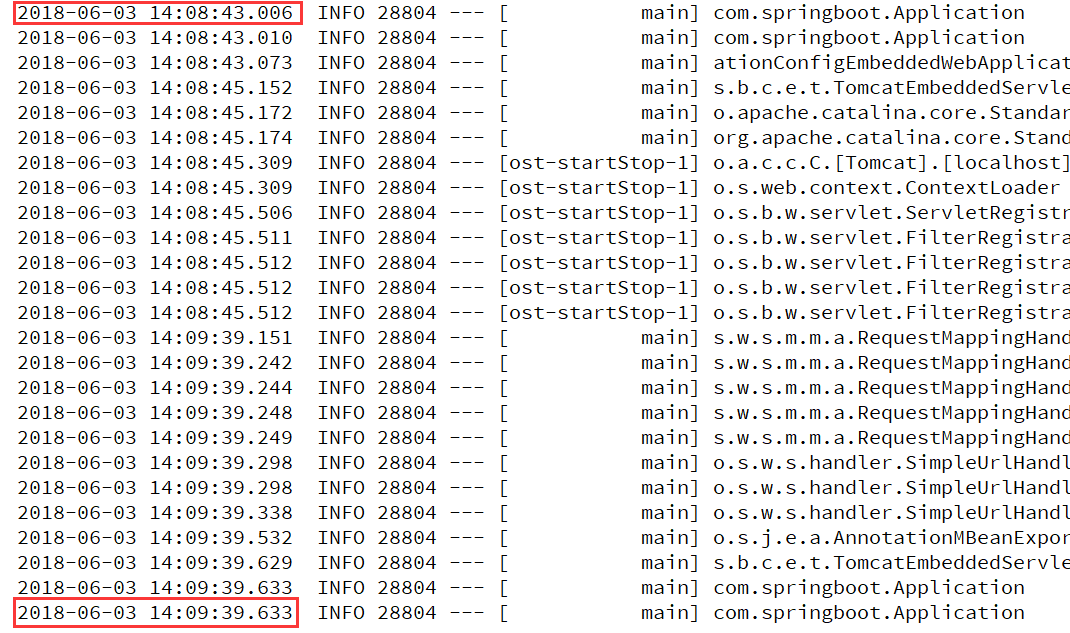
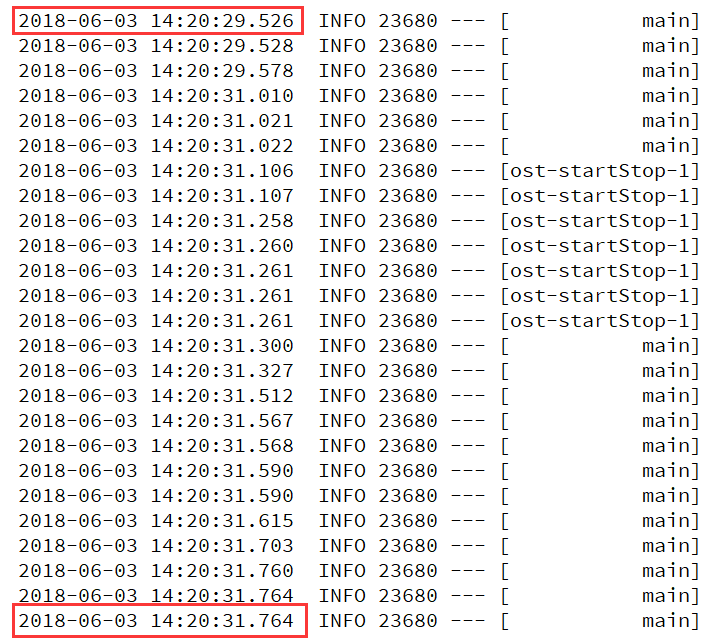
启动应用, 可以看到启动用了 56 秒, 这个时间是比较长的.
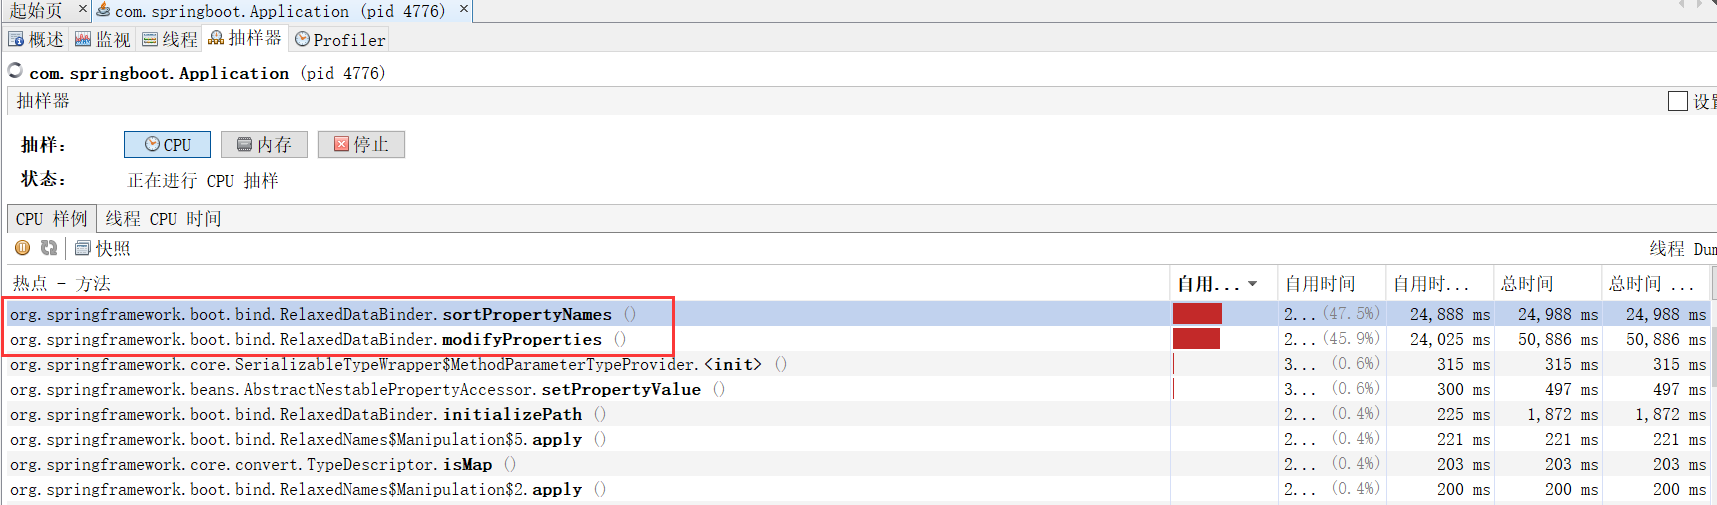
其实这里很容易猜测出来可能是由于配置的问题导致的, 毕竟应用非常简单, 也就两个两个配置而.但是在实际项目开发中, 功能很多, 不一定这么容易就能够猜测是因为这个原因导致的, 下面通过 jvisualvm 来观察是什么原因导致的.
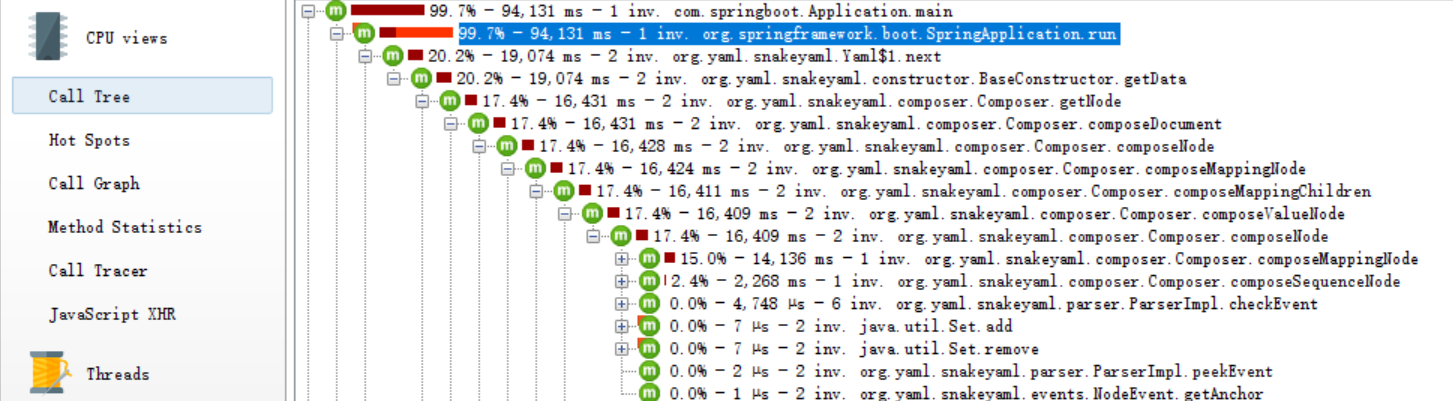
从上图中隐约的看出可能是元素排序导致的问题, 不是很清晰.那么再换 JProfiler 试试看, 如下图:
此时就毕竟清晰了, 可以看到解析 yaml 比较耗时.不过需要保留下怀疑态度, 真的是解析 yaml 过慢导致的问题吗? 这里先保留这个问题, 先看看如何解决这个问题.
解决方法也很简单, 大不了就自己解析.
不使用 yaml 文件, 就使用普通的文本, 每个元素就是一行.
配置类可改成如下所以, 这里以配置类表为例, 配置 map 与此类似:
1
2
3
4
5
6
7
8
9
10
11
12
13
14
15
@PostConstruct public void init() { LOG.info("read zip2.txt"); Resource resource = new ClassPathResource("zip2.txt"); // 注意: 使用流的方式读取 try (BufferedReader br = new BufferedReader(new InputStreamReader(resource.getInputStream(), "UTF-8"), 8192)) { String line; while ((line = br.readLine()) != null) { zip.add(line); } } catch (IOException e) { LOG.error("read error: ", e); } }
此时启动启用, 可以看到, 启动速度很快:
从这个示例中可以看到, 对于 yaml 中配置列表和 map 元素, 如果元素过多的话, 此时就不适合使用 Spring Boot 中的自动配置了, 会导致应用启动过慢.那么这个时候还不如自己去解析, 可以节省很多时间.
现在再回到上面的问题, 真的是如 jprfiler 分析的那样是因为解析 yaml 解析配置文件过慢吗? 可以写个测试类:
1
2
3
4
5
6
7
// codemap.yml、zip.yaml Resource resource = new ClassPathResource("codemap.yml"); Yaml yaml = new Yaml(); Iterable<Object> all = yaml.loadAll(resource.getInputStream()); for (Object obj: all) { ... }
运行上面的代码, 可以看到是很快的.
1
2
time: 79ms -- codemap.yml 解析时间 time: 1ms -- zip.yaml 解析时间
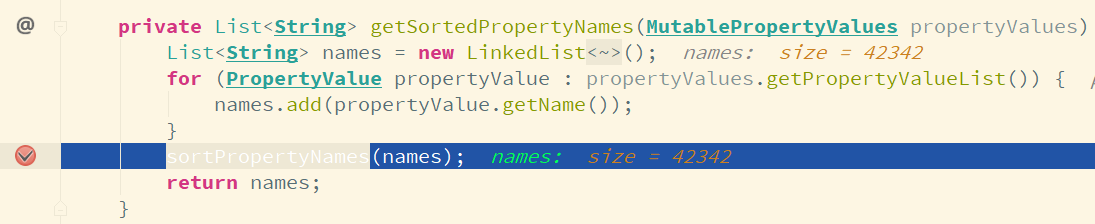
这里可以看出 jprofiler 给出的结果不准确.此时再重新审视下 jvisualvm 给出的结果, RelaxedDataBinder#sortPropertyNames() 方法耗时导致的项目启动速度慢, 在此方法上打上断点, 然后以 debug 模式启动项目, 可以看到当解析完 codemap.yml 文件之后, 运行到这个方法, 会导致 debug 几乎暂停, 运行了很长时间.
具体看下 RelaxedDataBinder#sortPropertyNames() 所做的操作:
1
2
3
4
5
6
7
8
9
10
11
12
13
14
15
16
private void sortPropertyNames(List<String> names) { for (String name : new ArrayList<String>(names)) { // LinkedList#indexOf() int propertyIndex = names.indexOf(name); BeanPath path = new BeanPath(name); for (String prefix : path.prefixes()) { // LinkedList#indexOf() int prefixIndex = names.indexOf(prefix); if (prefixIndex >= propertyIndex) { // The child property has a parent in the list in the wrong order names.remove(name); names.add(prefixIndex, name); } } } }
BeanPath 构造函数:
1
2
3
4
5
6
7
8
9
10
11
12
13
14
15
16
17
18
19
20
21
22
23
24
25
26
27
28
29
30
31
32
33
34
35
36
37
BeanPath(String path) { this.nodes = splitPath(path); } private List<PathNode> splitPath(String path) { List<PathNode> nodes = new ArrayList<PathNode>(); String current = extractIndexedPaths(path, nodes); for (String name : StringUtils.delimitedListToStringArray(current, ".")) { if (StringUtils.hasText(name)) { nodes.add(new PropertyNode(name)); } } return nodes; } private String extractIndexedPaths(String path, List<PathNode> nodes) { int startRef = path.indexOf("["); String current = path; while (startRef >= 0) { if (startRef > 0) { nodes.addAll(splitPath(current.substring(0, startRef))); } int endRef = current.indexOf("]", startRef); if (endRef > 0) { String sub = current.substring(startRef + 1, endRef); if (sub.matches("[0-9]+")) { nodes.add(new ArrayIndexNode(sub)); } else { nodes.add(new MapIndexNode(sub)); } } current = current.substring(endRef + 1); startRef = current.indexOf("["); } return current; }
从上面的代码中可以看到, 这里对 List(类型是 LinkedList) 元素循环进行 indexOf()、remove() 和 add(index, element) 操作, 另外就是在循环内实例化 BeanPath 对象, 查看 BeanPath 的构造函数, 所做的操作存在大量的字符串操作.不过 remove() 和 add(index, element) 的执行是有条件的.通过 debug 发现, 这两个方法并没有被执行到, 那么也就剩下 indexOf() 方法(实际执行的是 LinkedList#indexOf() 方法)和 BeanPath 的构造函数会被执行到, 而 LinkedList 是基于链表的, 查找某个元素的下标对于 LinkedList 来说是比较慢的, 再加上 BeanPath 构造函数内所做的字符串的查找、截取等操作(元素较少的情况下可能还觉察不出来, 元素一旦比较多就会导致程序执行耗费过多的时间), 这些操作加在一起导致了 RelaxedDataBinder#sortPropertyNames() 方法执行比较耗时.
到这里也就搞清楚了问题的原因, 也知道了该如何解决这个问题, 在配置元素过多的情况下, 如果项目启动过慢, 那么需要自己去解析配置文件而不是让 SpringBoot 帮我们解析.